Using Infographics to Quickly Communicate Success
Nonprofit organizations have a particular need to show the community how they are using funds for the greater good. Using a graphical way to display this information can make statistical data easier to absorb as well as create a memorable impact.
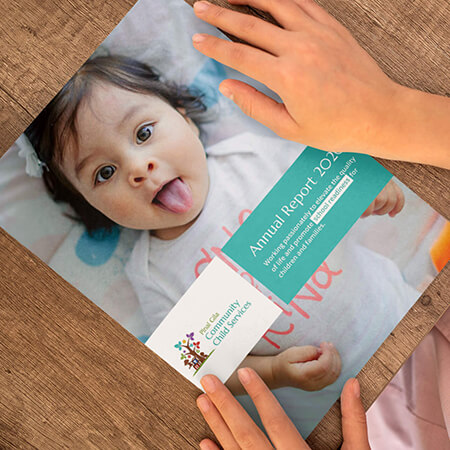
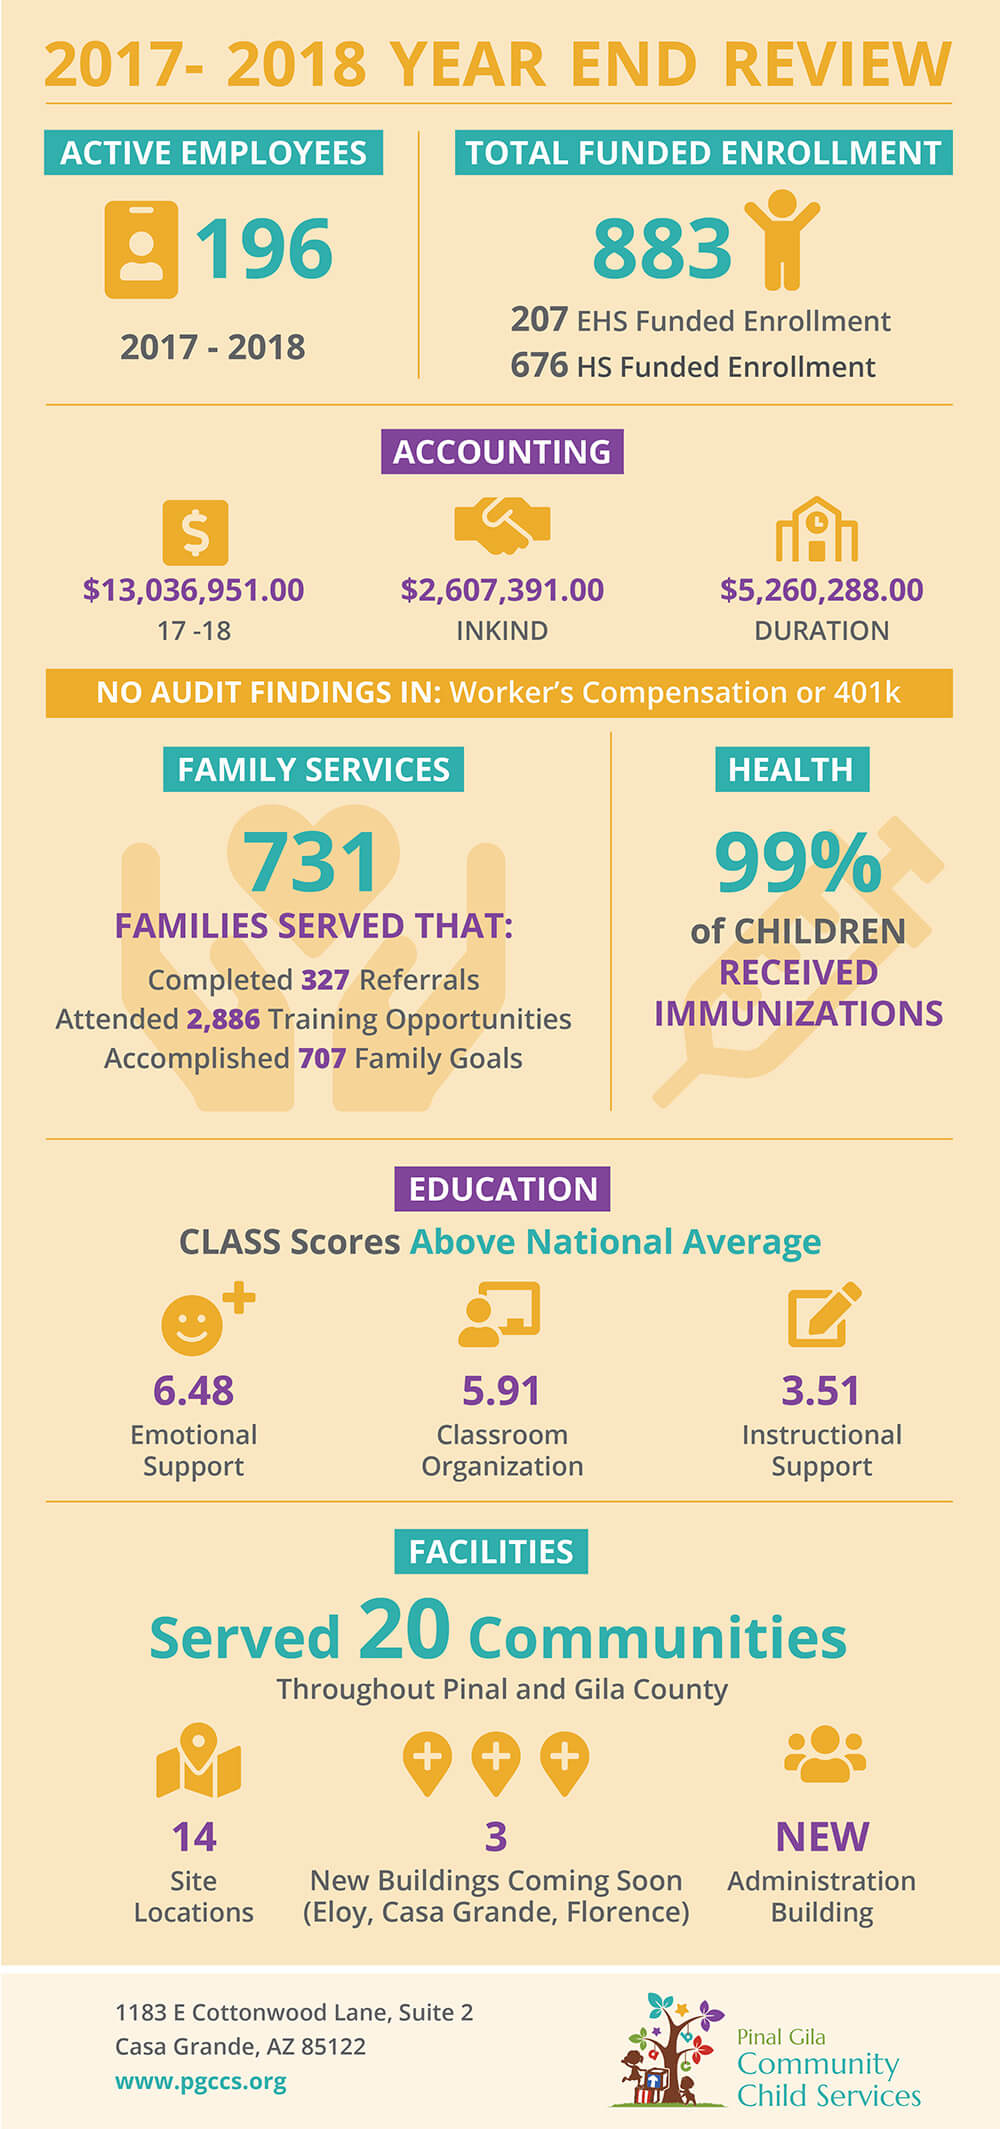
Here are two samples of infographics created for nonprofits: SEICAA (a Community Action Agency) and Pinal Gila Community Child Services (a Head Start organization). These illustrate how nonprofits can use information from their annual reports to create the infographic. The benefits are:
- Reduced annual report printing and printing costs: the infographic can be used in lieu of, or to supplement a full-blown annual report. In SEICAA’s case they are using an infographic to share results every other year.
- Relevant content for social sharing: an infographic is easy to share and offers a quick takeaway of key metrics.
- Content can be repurposed in multiple ways: the infographic can be divided into individual graphics that are easy to share on social media, use in email marketing, and post on a website.
- Ideal for community outreach: the graphics can be sent out to community news outlets for sharing.
- Great for meetings and events: the infographic can be printed in a large scale and posted during events.

On-brand and easy to digest.
Using big numbers and icons, these infographics make a page of data more interesting and impactful.
View other samples


Website for Organizing Complex Data – The Wing InstituteSuzanne Garcia-Misa2021-05-25T03:21:20+00:00


Short Span Steel Bridge Alliance Trade Show Booth and MarketingSuzanne Garcia-Misa2019-11-09T00:10:21+00:00


Website Promotes Referrals for Home Health Agency – Blossom RidgeJannah Lyon2021-05-24T21:05:52+00:00


Custom Order Portal for Distributors – Prime Source FloralSuzanne Garcia-Misa2023-01-25T18:42:54+00:00


Economic Development Printed Marketing – City of HerculesSuzanne Garcia-Misa2019-11-25T19:25:15+00:00